Tuesday, January 27, 2009

Will US Bancorp cut its dividend?

I've been following US Bancorp (USB) pretty closely through this credit crisis -- thanks to Jim Jubak. He thinks it is one of the few banks that will emerge from this crisis victorious, and I tend to agree with him.

The stock currently yields ~12%, but much of that is due to the fear of a dividend cut caused by the most recent earnings release. Jim Jubak's comments are below.

Will US Bancorp follow the lead of so many of its peers in the banking industry and cut its dividend? The question isn't academic to me: I had added this stock to Jubak's Picks in April 2008 because it then paid better than 5%.

Since the company's Jan. 21 announcement on fourth-quarter earnings, a majority of investors on Wall Street have been thinking the dividend is headed for a cut. A stock-price drop of 12.5% on Jan. 22 left the yield on the shares at 12.1%. You don't see that kind of a yield on a bank stock unless the market is convinced the company will cut its payout.

I can certainly see why investors think that. The bank didn't exactly give a ringing defense of the dividend in its earnings conference call. Executives said the company believes it will be able to cover the dividend from earnings in 2009 but noted that it reviews the dividend every 90 days -- which puts the next review in March -- and that the bank has no intention of continuing the current dividend if earnings don't cover the payout.

The real issue then, as the company said in its statement, is earnings for the rest of 2009. On Jan. 21, US Bancorp reported earnings of 15 cents a share. That's a profit -- unusual for a bank these days -- but still 7 cents a share below what Wall Street had expected. The problems? There were $253 million in losses on securities and a $635 million increase in provision for credit losses. All in all, charges and losses chopped 34 cents a share out of earnings.

It's also clear that the bank's business, like that of all banks I know of, is still getting worse. Nonperforming assets climbed to 1.14% in December, and the bank said it anticipated that nonperforming assets -- that is, loans that the bank can't collect on in a timely fashion -- will continue to climb in 2009. It's cold comfort to investors that the bank's performance continues to be so much better than other banks'. The increase in nonperforming assets to 1.14% in December is only a modest increase from the 0.88% in September. That indicates the bank's lending standards continue to hold up to a very difficult economy.

The bank's operating results, in fact, were quite impressive. Loans grew 17% (12.7% excluding acquisitions) and deposits 15.2% (9.6% excluding acquisitions) from the fourth quarter of 2007. (In November 2008, the company acquired Downey Savings and Loan and PFF Bank and Trust from the Federal Deposit Insurance Corp.) Net interest income grew 22.6%. Tier 1 capital remained at a strong 10.6%.

So will US Bancorp cut the dividend or not? Unfortunately, it's a danger and, also unfortunately, uncertain. It depends on how long the economy struggles and how big the losses get on the bank's portfolio of loans. I still think US Bancorp will be a winner in the current crisis, and this quarter's results are evidence that the bank is picking up loan and deposit volume as customers opt for the bank's relative safety.
Source:
Fed looks like one more shaky bank
Jubak's Journal, 1/23/2009 12:01 AM ET

Wednesday, November 26, 2008

10-year Treasury at 2.995%

The 10-year Treasury briefly dipped below 3% this morning. Is this a reflection of fear, deflation, or a result of all the money being poured into the system over the past few months?

Thursday, November 13, 2008

Stock Surge Off New Lows

Both the S&P500 and the Nasdaq Composite registered fresh 52-week lows around 1:00EST during today's session. Soon after, they both began rallies and would close a massive 10% higher than their intra-day lows. Volume surged on both the NYSE and the Nasadaq (see charts below - or links in the blog's right-hand column) as the rally progressed.

NYSE:

Nasdaq:

The charts above show that volume picked up during the rally and was much higher than the past several days on both exchanges. (The bottom portion of the chart shows today's volume relative to yesterday.)

Further, breadth was impressive: advancing issues outnumbered decliners on both the NYSE (2,650/919) and NASDAQ (2,089/799). Up volume accounted for 77% of the NYSE volume, while 89% of the Nasdaq volume was positive.

Could this rally mark the end of this devastating - in both speed and magnitude - bear market? Stay tuned...

Wednesday, October 29, 2008

Fed Holds Rates Steady

The opening sentence of today's FOMC statement reads:

The Federal Open Market Committee decided today to lower its target for the federal funds rate 50 basis points to 1 percent.
Decided today, really? By looking at the effective federal funds rate, it looks like this policy action was decided two weeks ago.

Thursday, October 23, 2008

Last-Minute Rally

With one and a half hours left in today's session, the S&P 500 rose from its intraday low of 860 to 908 at the close. That's a 5.6% intraday move to close the session up 1.26%. That's quite an impressive rally, but how was volume and breadth?


The chart above shows NYSE volume was much heavier today than the past couple days. The bottom portion of the chart shows today's volume relative to yesterday.

Cumulative volume compared to yesterday increased steadily all day, as stocks fell, until the last couple hours of trading. This suggests buying was sparse even though the price movement was strong.

Further, breadth was not at all impressive: declining issues outnumbered advances on both the NYSE (2,152/1,291) and NASDAQ (2,032/824).

New Blog - FOSS Trading

I've started a new blog to focus on trading and quantitative finance using free open source software. I will post updates on my R packages on that blog instead of Quantitative Contemplations.

You can find the new blog at http://blog.fosstrading.com.

Wednesday, October 22, 2008

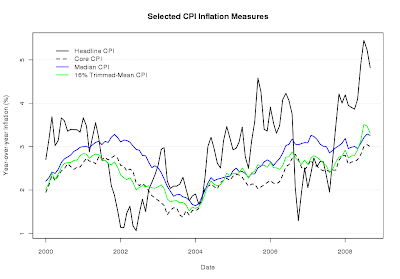
September Inflation

The chart below shows headline and core CPI have climbed sharply since mid-2006. Headline CPI is currently near 5% year-over-year, while all measures of core CPI are at 3%.

Why, even though inflation is high and has been increasing, does the Fed consider inflation expectations to be contained? The Fed noted the fall in commodity prices, which will dampen inflation in coming months, in their October 8th statement. They also noted inflation expectations have diminished.

The following chart shows inflation expectations via the spread between the 10-year constant maturity Treasury rate and the corresponding TIPS rate. Expectations currently stand at an average of 1% per year for the next 10 years. I seriously doubt this will be realized; it's more likely a function of the current market pessimism.


Two important caveats: (1) the spread has two components - expected inflation and inflation risk premium, and (2) TIPS yields have a liquidity premium. Given the short-term nature of our comparison, neither of these caveats should be too problematic.