The 10-year Treasury briefly dipped below 3% this morning. Is this a reflection of fear, deflation, or a result of all the money being poured into the system over the past few months?


Peak Performance Priorities
1 week ago
The 10-year Treasury briefly dipped below 3% this morning. Is this a reflection of fear, deflation, or a result of all the money being poured into the system over the past few months?
Both the S&P500 and the Nasdaq Composite registered fresh 52-week lows around 1:00EST during today's session. Soon after, they both began rallies and would close a massive 10% higher than their intra-day lows. Volume surged on both the NYSE and the Nasadaq (see charts below - or links in the blog's right-hand column) as the rally progressed.


The opening sentence of today's FOMC statement reads:
The Federal Open Market Committee decided today to lower its target for the federal funds rate 50 basis points to 1 percent.Decided today, really? By looking at the effective federal funds rate, it looks like this policy action was decided two weeks ago.
With one and a half hours left in today's session, the S&P 500 rose from its intraday low of 860 to 908 at the close. That's a 5.6% intraday move to close the session up 1.26%. That's quite an impressive rally, but how was volume and breadth?
The chart above shows NYSE volume was much heavier today than the past couple days. The bottom portion of the chart shows today's volume relative to yesterday.
Cumulative volume compared to yesterday increased steadily all day, as stocks fell, until the last couple hours of trading. This suggests buying was sparse even though the price movement was strong.
Further, breadth was not at all impressive: declining issues outnumbered advances on both the NYSE (2,152/1,291) and NASDAQ (2,032/824).
I've started a new blog to focus on trading and quantitative finance using free open source software. I will post updates on my R packages on that blog instead of Quantitative Contemplations.
You can find the new blog at http://blog.fosstrading.com.
The chart below shows headline and core CPI have climbed sharply since mid-2006. Headline CPI is currently near 5% year-over-year, while all measures of core CPI are at 3%.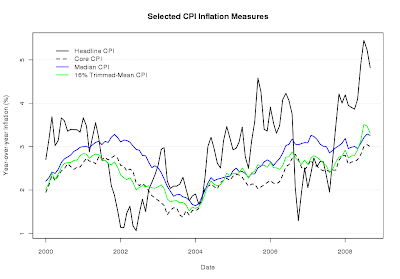
The following chart shows inflation expectations via the spread between the 10-year constant maturity Treasury rate and the corresponding TIPS rate. Expectations currently stand at an average of 1% per year for the next 10 years. I seriously doubt this will be realized; it's more likely a function of the current market pessimism.
Two important caveats: (1) the spread has two components - expected inflation and inflation risk premium, and (2) TIPS yields have a liquidity premium. Given the short-term nature of our comparison, neither of these caveats should be too problematic.
Today was the first day since September 19 that many financial stocks could be sold short. And there was certainly a lot of selling today. The Financial Select Sector ETF (XLF) dropped 10.4%.
If you only consider today's action, you may conclude that the short-selling ban was working. That could not be further from the truth. Financials rose nearly 12% on the day the ban was instituted, but it was almost all downhill after that. Only 4 of the next 13 days were positive. Over the whole period the ban was in effect, the XLF fell 23.6% (from the close on 9/18 to the close on 10/8).
The major indices have seen declines, many of them severe, in the last 7 consecutive trading sessions. We most certainly would have seen a short-squeeze within that period, had short sales been allowed.


